TimeChart UI Layout
The initial UI of TimeChart, when first started, presents the following layout:
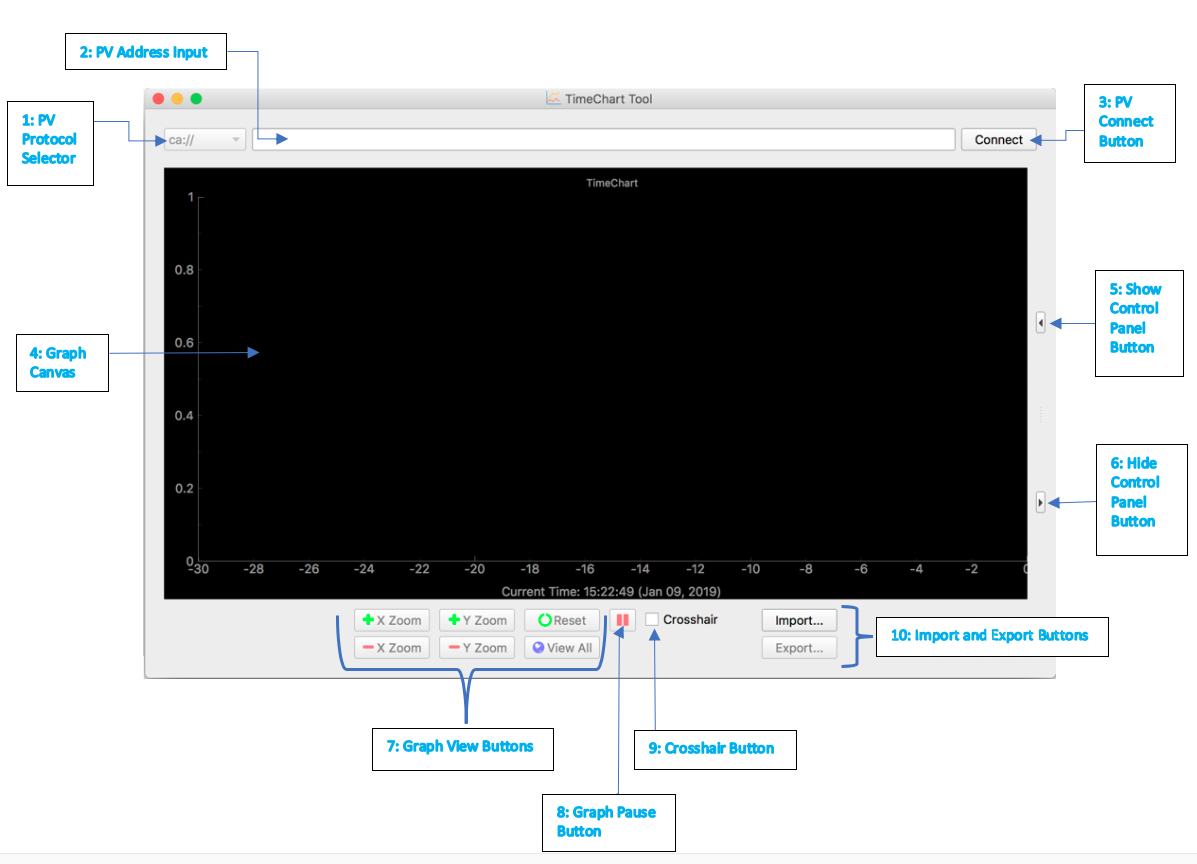
- Process Variable (PV) Protocol Selector:
Currently, only Channel Access (CA) is supported. If another protocol support is available, e.g. Archiver, you will be able to change the protocol selection, e.g. to
archive://.
- PV Address Input:
You can either type or copy and paste, and then hitting the <Enter> or <Return> keyboard key to start TimeChart charting, or click on the Connect button next to the PV Address Input.
- PV Connect Button:
Click on this button for TimeChart to start rendering the curve for the PV address provided in the PV Adress Input if you do not want to press the <Enter> or <Return> keyboard key.
- Graph Canvas:
The area where a graph is to be drawn.
- Show Control Panel Button:
Click on this button to review the Control Panel, which will also be automatically revealed when the first PV you enter for charting. You can click on this button to show the Control Panel whenever it is hidden.
- Hide Control Panel Button:
Click on this button to hide the Control Panel and provide more space for the Graph Canvas.
- Graph View Buttons:
Use these buttons to adjust the viewing of the graph:
+ X-Zoom: Zoom in on the x-axis
- X-Zoom: Zoom out on the x-axis
+ Y-Zoom: Zoom in on the y-axis
- Y-Zoom: Zoom out on the y-axis
Reset: Restore the zoom levels of the x-axis and the y-axis to the default
View All: Automatically adjust the zoom levels of both the x-axis and the y-axis so that all the current curves’ data points already plotted on the graph will be visible.
- Graph Pause Button:
Click on this button to toggle pausing or resuming drawing an ongoing graph. During pausing, data continues to be collected and buffered. During resume, the graph continues drawing at the last data point where it was paused.
- Crosshair Button:
Click on this button to toggle turning on or off the crosshair on the Graph Canvas. The crosshair can moved across the Graph Canvas, with TimeChart UI providing the current x and y coordinates of the crosshair. This can be useful to obtain the x and y coordinates of any point on a curve.
Import and Export Buttons:
- Import Button:
Clicking on this button will let you to import configuration settings and also PV addresses from a file for TimeChart to draw immediately. The file can be a TimeChart configuration file (in the JSON format), or an EPICS StripTool file (in the STP format).
- Export Button:
Clicking on this button will let you export the following data:
Graph data points, into a CSV file
Chart configuration settings, including the optional PV addresses, into a JSON file
A snapshot image of the current graph, into a PNG file