Control Panel
The Control Panel contains three tabs:
Curves: controls the settings pertaining to a specific curve in the Graph Canvas
Data: controls the settings pertaining to how the graph processes the plot data
Graph: controls the settings pertaining to the graph’s overall appearances
Curves
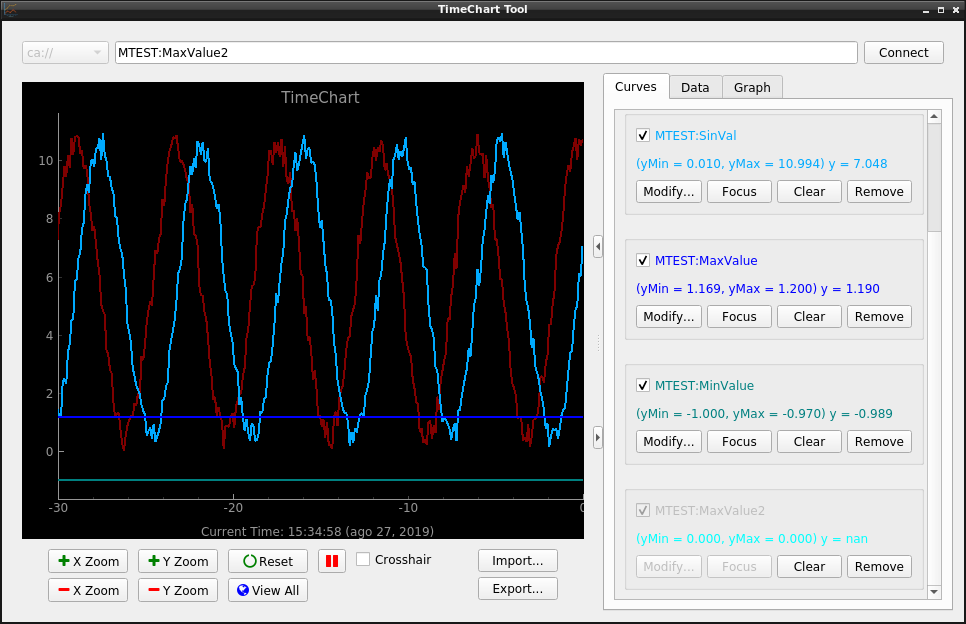
For every curve being drawn on the graph, the following curve data and control options are available:
- Curve Checkbox:
Next to every PV name is a checkbox that is checked by default. Uncheck this checkbox will make the curve hidden and not appearing on the graph canvas, and check this checkbox again will show the PV’s curve. Although invisible, the PV’s curve will continue to be plotted.
- Curve Name:
The name of the PV whose curve is being plotted. Under the Curve Name are the current y-min and y-max values of the curve, and the current y-value just plotted on the curve.
Important
The color of the PV name as listed in the Control Panel’s Curves page is the same with the color of its corresponding curve. This helps you match which curve is being drawn for which PV name.
If the color of the PV name as listed in the Control Panel’s Curves page is grey, this indicates that the PV with such a name is not active, i.e. TimeChart is not receiving data from that PV, and no curve is being drawn for that PV. You must check the PV connection in that case.
On the other hand, if the inactivity is temporary, the PV name will change to its assigned color, and the PV’s curve will start being drawn when the PV is active again.
- Modify Button:
Click on this button will display the options for you to modify:
Color: The color of the curve
Symbol: The shape of the curve’s markers. The default is no markers
Symbol Size: The size of the markers. The default is 10
Line Style: Whether the line is solid (default) or is a combination of dashes and dots
Line Width: How thick the curve line is. The default is 2
Reset: Click on the Reset button to reset all the curve settings, except for the already selected curve color, to the default values.
- Focus Button:
Click on this button to automatically adjust the x and y value ranges so that the current curve (which the Focus Button is assigned for) will be displayed completely in the Graph Canvas.
- Clear Button:
Click on this button to clear the history of the current curve and continue accummulating new data.
- Remove Button:
Click on this button to delete the PV’s curve from the Graph Canvas. TimeChart will also stop collecting data for this PV.
Data
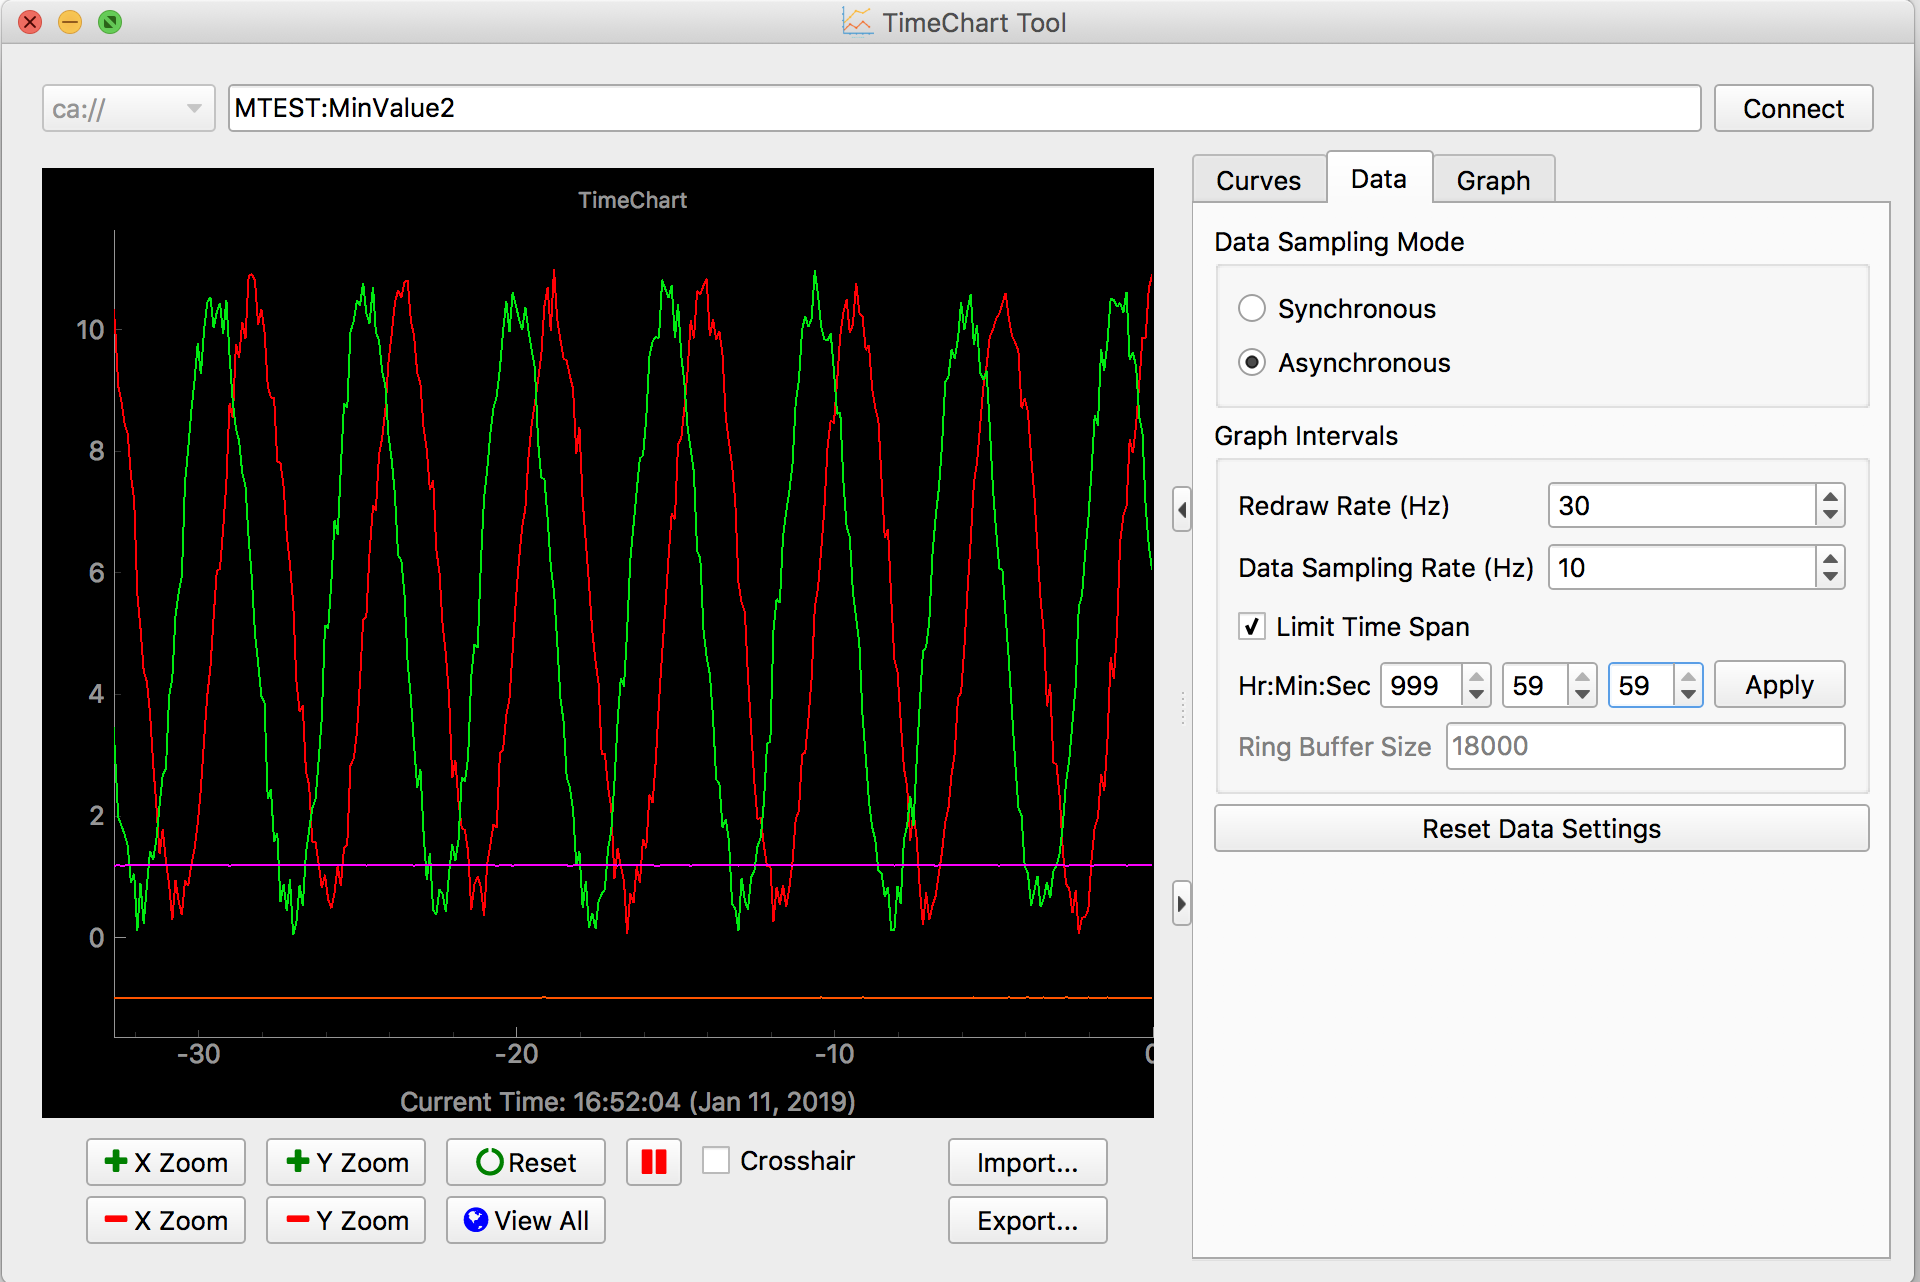
- Data Sampling Mode:
This option affects how TimeChart processes data for plotting of all the provided PVs:
- Synchronous:
TimeChart plots a new data point for a curve as soon as it receives a new data point from the PV.
- Asynchronous:
Default. TimeChart checks for new data points at a regular interval (frequency), as specified by the Data Sampling Rate (Hz) value in the
Graph Intervalssection, as provided by the user. TimeChart then plots any accummulated new data points.Important
If you select the Synchronous data sampling mode, you cannot make any setting changes affecting how often TimeChart checks for new data points or how long TimeChart should collect the data points. Consequently, the
Data Sampling RateandLimit Time Spaninputs will be hidden in the Synchronous Data Sampling Mode.
- Graph Intervals:
This option affects how often TimeChart updates the graph:
- Redraw Rate (Hz):
Default is 30 Hz. Minimum 1 Hz. Maximum 240 Hz. How often TimeChart redraws the current curves already plotted. This controls how smoothly the curves are to be drawn.
- Data Sampling Rate (Hz):
Default is 10 Hz. Minimum 1 Hz. Maximum 360 Hz. How often TimeChart checks for new data points in a second to update its curves. For instance, if the Data Sampling Rate is 10 Hz, TimeChart checks for new data points for each curve 10 times a second.
- Limit Time Span:
Default is Off. If checked, limit the charting operations to a time constraint of maximum 999 hours, 59 minutes, and 59 seconds. Depending on the hour, minute, and second values provided for this time constraint, TimeChart will limit the number of data points collected so that it will provide the graph for the duration provided by this Limit Time Span.
Important
You must click on the Apply Button after setting the hour, minute, and second constraint values for the Time Span Limit to take effect.
Ring Buffer Size. Default is 18000. The number of data points to be collected and charted by TimeChart before writing the latest data points over the oldest data in the data point circular buffer.
Important
The time constraint set by
Limit Time Spandirectly affects theRing Buffer Size. Consequently, if you set a time span limit, you cannot manually set the ring buffer size. So, The Ring Buffer Size text input will be disabled (grayed out) if you check on the Limit Time Span checkbox.
- Reset Data Settings Button:
Click on this button to reset all the settings in the Data tab to the default values.
Graph
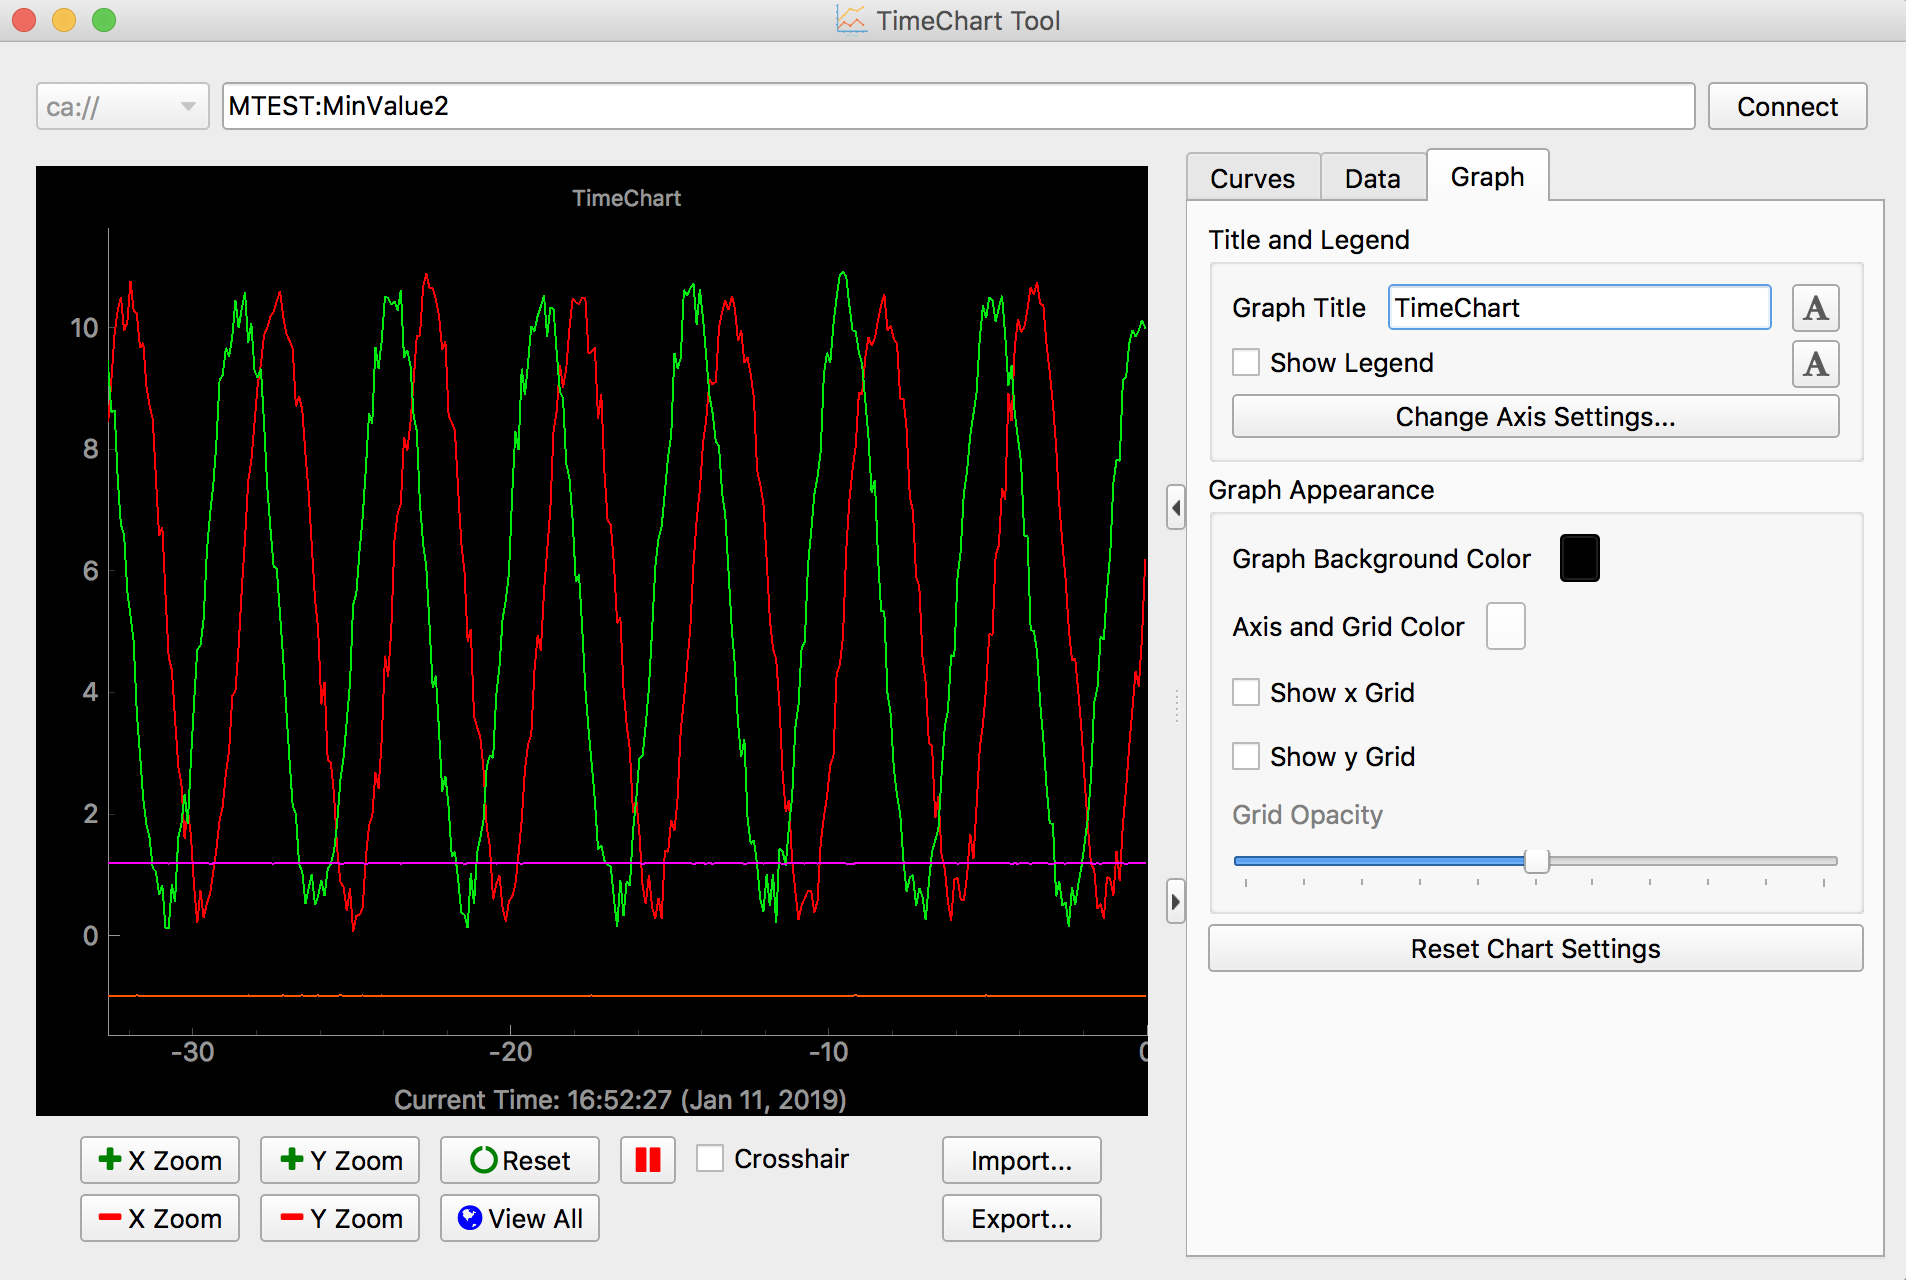
- Title and Legend:
Change the Title and Legend settings of the entire graph:
- Graph Title:
Default is “TimeChart”. You can customize the graph title, and also its font, font style, and font size by clicking on the Style button next to the text edit.
- Show Legend Checkbox:
Default is unchecked. You can check this box to display the legend, which provides all the active curves’ names and their line colors on the graph.
- Change Axis Settings Button:
Click on this button will allow you to set:
Labels and Units for the x-axis and y-axis
Whether to display a right y-axis (not displaying by default), and the Label and Unit for the right y-axis
The font, font style, and font size for the Labels.
- Graph Context Menu:
You can also right-click on the Graph Canvas to access additional setting options for the graph:
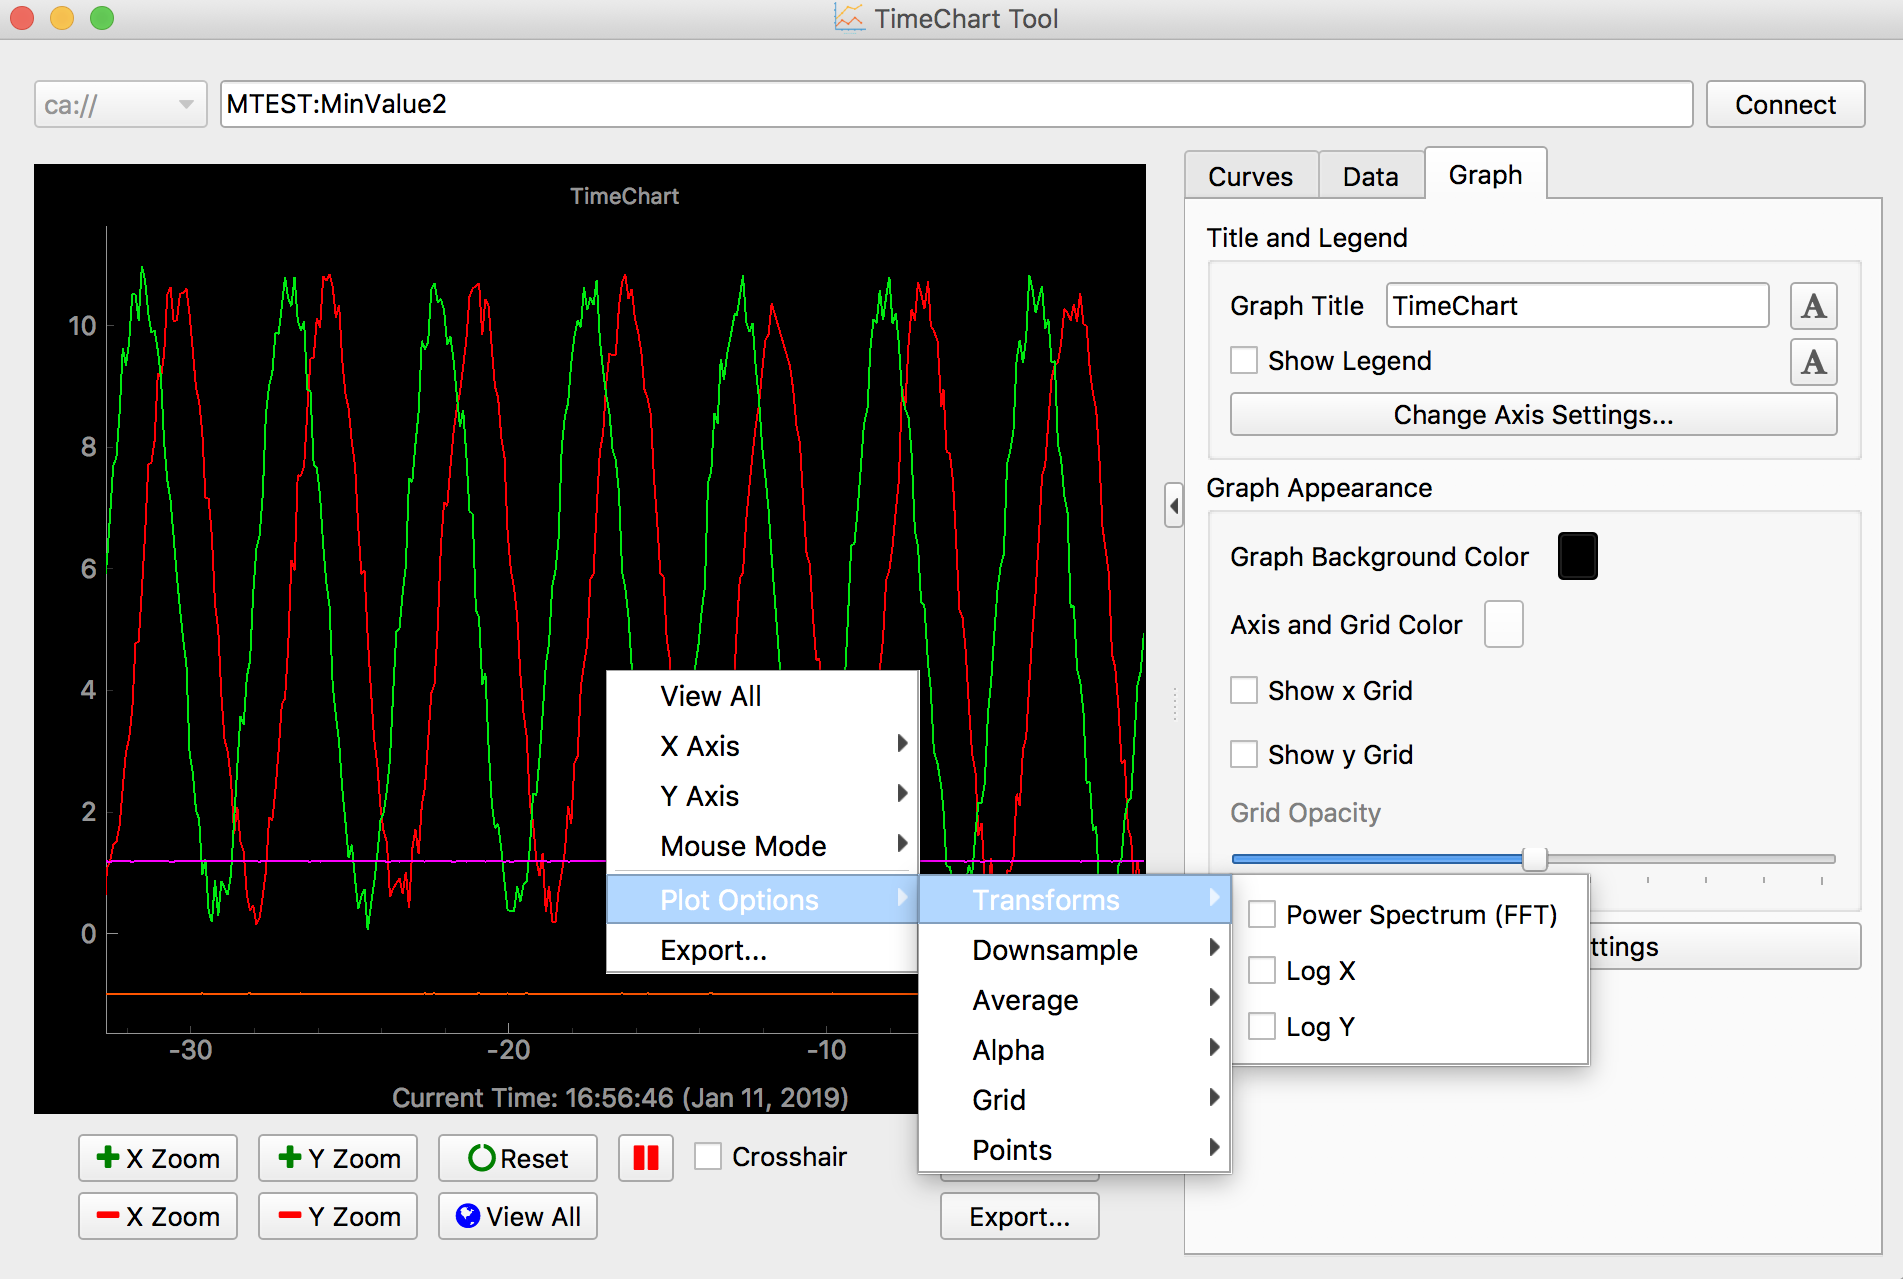
- View All:
Adjust the x-axis scale to show all the entire graph’s data points since the graph was started.
Important
This option can produce a very condensed graph. Click on the Reset button to revert the graph to the default scale if necessary.
- X-Axis and Y-Axis:
Options to adjust the x and y value ranges, whether to allow mouse dragging, and whether to invert either or both axes.
- Mouse Mode:
Whether to simulate a three-button mouse or two-button mouse.
- Plot Options:
You can set either the x or y axis, or both axes, to log scale, by selecting the Transforms sub-menu.
- Graph Appearance:
Other general appearance of the entire graph:
- Graph Background Color Button:
Default is Black. Click on this button to pick a different background color for the graph.
- Axis and Grid Color Button:
Default is White. Click on this button to pick a different color for the graph’s axes and grid.
- Show x Grid Checkbox:
Default is unchecked. Check this button to show the vertical grid lines on the graph.
- Show y Grid Checkbox:
Default is unchecked. Check this button to show the horizontal grid lines on the graph.
- Grid Opacity:
Default is 5. Drag this slider to the left to reduce the visibility of the grid lines, or to the right to increase the visibility of the grid lines. This option is available only if either the
Show x Grid Checkboxor theShow y Grid Checkboxis checked.
- Reset Chart Settings Button:
Click on this button to revert all the Title and Legend and Graph Appearance setting values back to the defaults.