Introduction
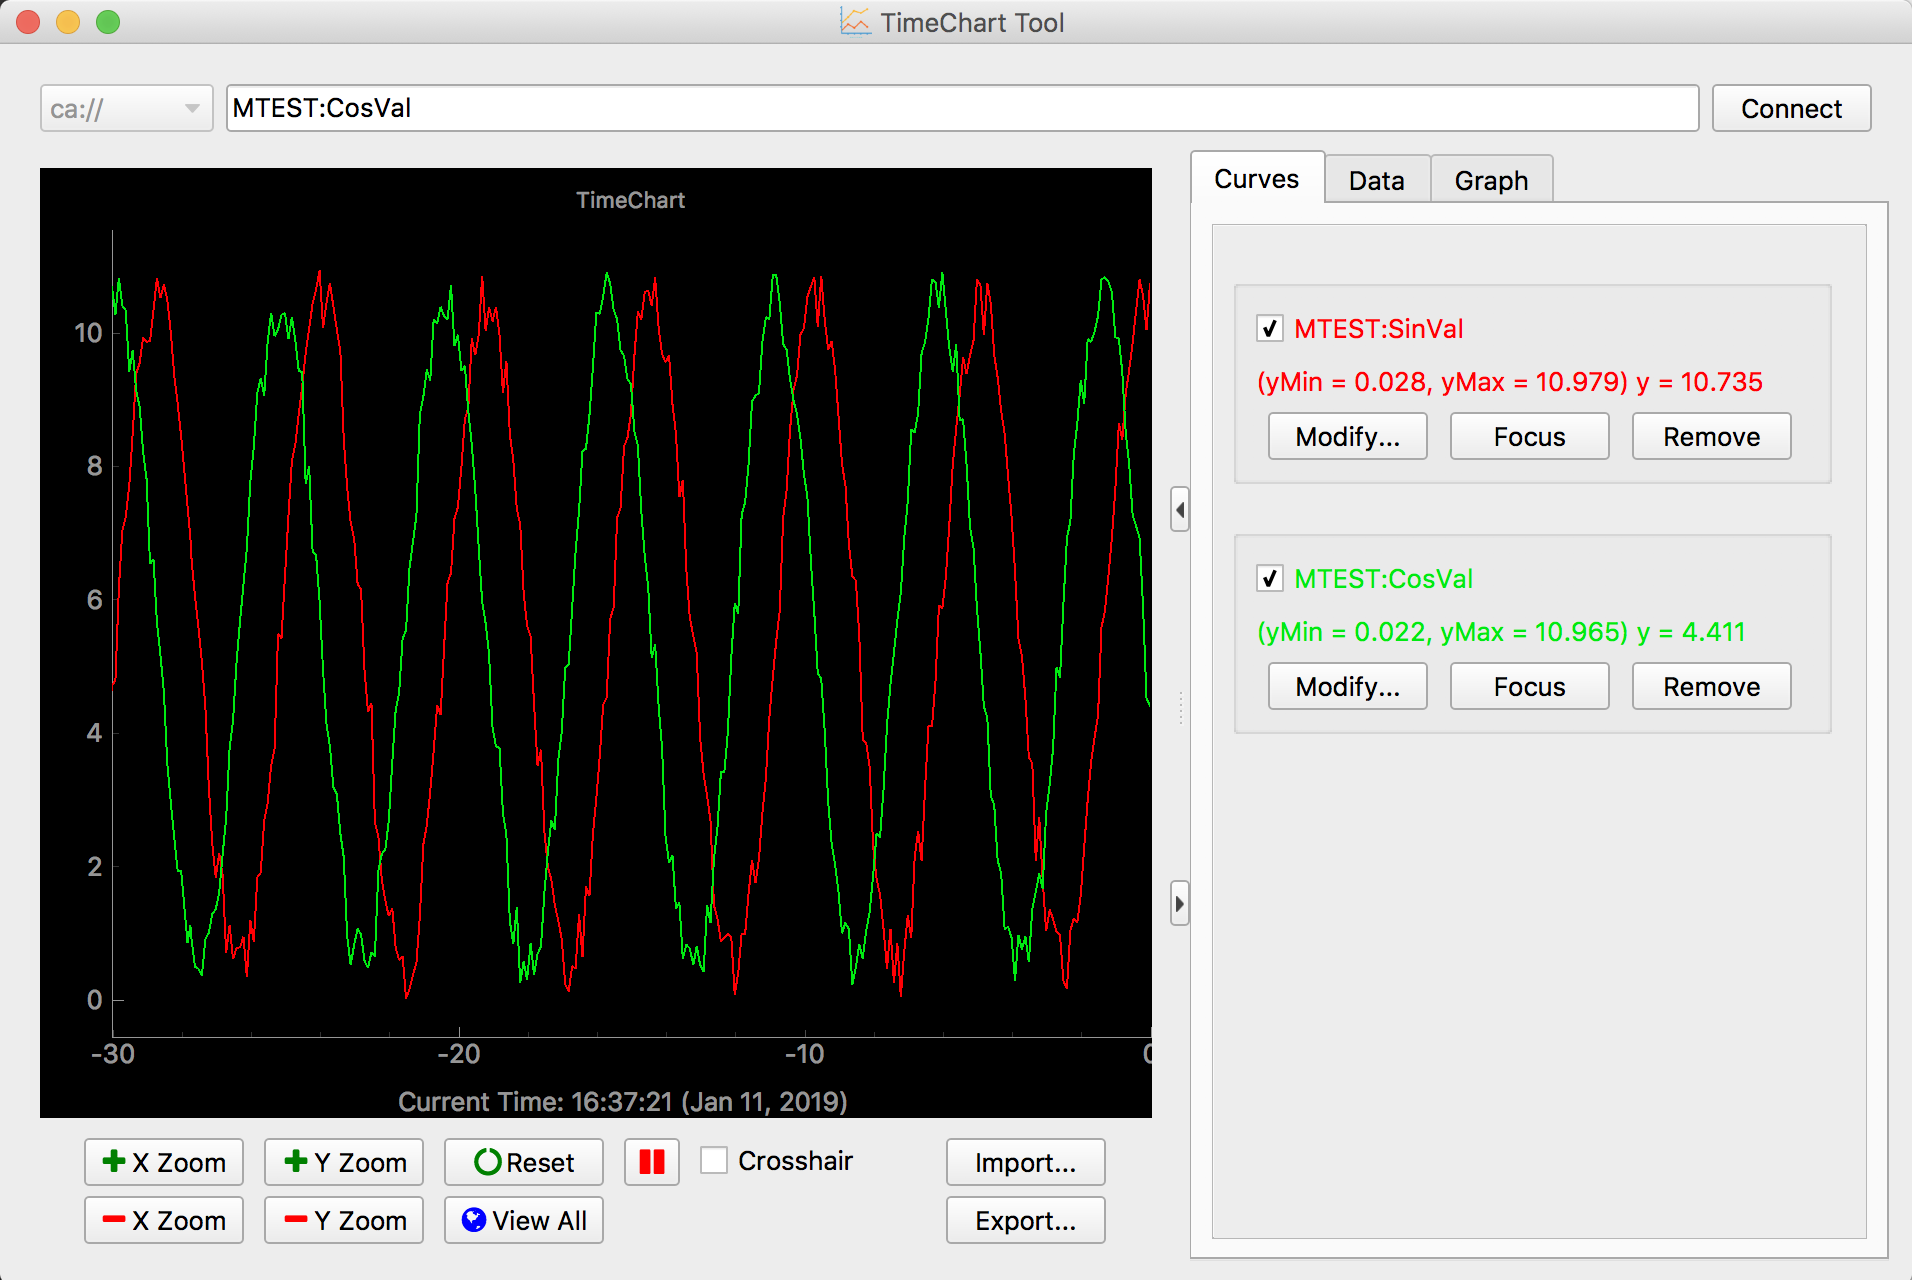
TimeChart is a Python application that plots the time evolution of one or more Process Variables on a chart. It is currently working with EPICS Channel Access.
TimeChart was created using Python, Qt, and can run on Linux, macOS, and Windows. Refer to Prerequisites for requirements and installation instructions.