Archiver Appliance Enabled Time Plots
Time plots can be augmented with the ability to automatically request archived data from an instance of the EPICS archiver appliance if such an instance is available to the user.
In order to use this functionality, the environment variable PYDM_ARCHIVER_URL must be set to point to the archiver appliance instance. For example:
export PYDM_ARCHIVER_URL=http://lcls-archapp.slac.stanford.edu
These plots can then be created with python code, or using designer.
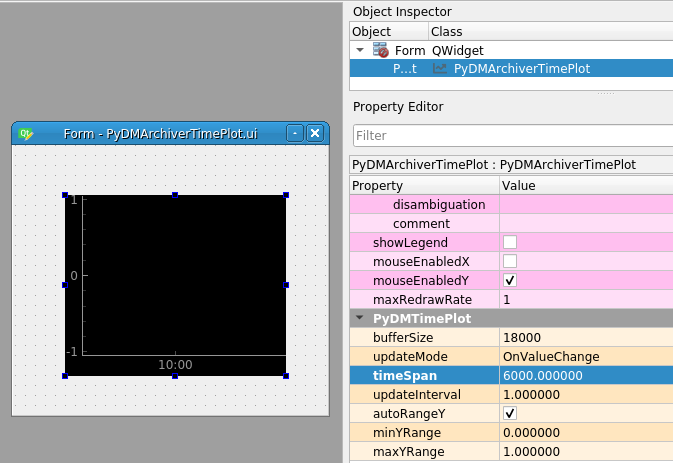
Creating in Designer
After setting the above environment variable, archiver time plots will then be able to be created in designer through the usual drag and drop flow. Upon opening designer, there will now be a plotting widget called PyDMArchiverTimePlot available for use. The channel connections can be created in the same way as a regular time plot, no need to preface anything with “archiver://”, the requests to archiver will happen automatically upon running the plot and panning the x-axis to the left, or zooming out.
One property that will be particularly useful to set is the timeSpan. This value (in seconds) will determine how much data to request from archiver upon plot initialization. For example, setting it to 600 will cause the plot to backfill with the last 10 minutes worth of data for the plotted values anytime the plot is opened. If more data is needed after starting up the plot, it can be requested as described below.
Plot Usage
Upon opening the plot, it will plot the requested amount of archived data. It will then behave like a regular time plot with live data being added to the plot. If more archived data would be useful, requests can be made by either panning the x-axis to the left, or zooming out on the entire plot. This will automatically generate a call to the archiver appliance that will add data to the plot once it is received.
Note that there is a property on the plot called bufferSize which determines how many data points can be displayed on the plot at once. If the request for archived data would return an amount greater than that buffer, it will convert to a request for optimized data which includes the average, min, and max of each data point returned. These will then be plotted as bars to show the full range of data represented by each point. As an example - with a buffer size of 365, a request for a year of data for a PV that updates every second would return roughly 365 points each of which will contain the min and max of that day’s data to plot the full range represented.
PyDMArchiverTimePlot
- class pydm.widgets.archiver_time_plot.PyDMArchiverTimePlot(parent: Optional[QObject] = None, init_y_channels: List[str] = [], background: str = 'default', optimized_data_bins: int = 2000, request_cooldown: int = 1000, cache_data: bool = True, show_all: bool = True, show_extension_lines: bool = False)[source]
Bases:
PyDMTimePlotPyDMArchiverTimePlot is a PyDMTimePlot with support for receiving data from the archiver appliance.
- Parameters:
parent (QObject, optional) – The parent of this widget.
init_y_channels (list) – A list of scalar channels to plot vs time.
background (str) – The background color for the plot. Accepts any arguments that pyqtgraph.mkColor will accept.
optimized_data_bins (int) – The number of bins of data returned from the archiver when using optimized requests
request_cooldown (int) – The time, in milliseconds, between requests to the archiver appliance
cache_data (bool) – Whether curves should retain archive data or fetch new data when the x-axis changes
show_all (bool) – Shifts the x-axis range to show all data, or stay where the user set the x-axis to
show_extension_lines (bool) – Show a line extending from the right most point for all curves, defaults to False
- addFormulaChannel(yAxisName: str, **kwargs) FormulaCurveItem[source]
Creates a FormulaCurveItem and links it to the given y axis
- addYChannel(y_channel=None, plot_style=None, name=None, color=None, lineStyle=None, lineWidth=None, symbol=None, symbolSize=None, barWidth=None, upperThreshold=None, lowerThreshold=None, thresholdColor=None, yAxisName=None, useArchiveData=True, liveData=True, showExtensionLine=None) ArchivePlotCurveItem[source]
Overrides timeplot addYChannel method to be able to pass the liveData flag.
- archive_data_received()[source]
Take any action needed when this plot receives new data from archiver appliance
- property cache_data
Returns if the curves of the plot are caching archive data or fetching new archive data on every change to the x-axis
- createCurveItem(*args, **kwargs) ArchivePlotCurveItem[source]
Create and return a curve item to be plotted
- getCurves() List[str][source]
Dump and return the current list of curves and each curve’s settings into a list of JSON-formatted strings.
- requestDataFromArchiver(min_x: Optional[float] = None, max_x: Optional[float] = None) None[source]
Make the request to the archiver appliance data plugin for archived data.
- Parameters:
min_x (float, optional) – Timestamp representing the start of the time period to fetch archive data from. Defaults to the minimum value visible on the plot when omitted.
max_x (float, optional) – Timestamp representing the end of the time period to fetch archive data from. Defaults to the timestamp of the oldest live data point in the buffer if available. If no live points are recorded yet, then defaults to the timestamp at which the plot was first rendered.
- setAutoScroll(enable: bool = False, timespan: float = 60, padding: float = 0.1, refresh_rate: int = 5000)[source]
Enable/Disable autoscrolling along the x-axis. This will (un)pause the autoscrolling QTimer, which calls the auto_scroll slot when time is up.
- Parameters:
enable (bool, optional) – Whether or not to start the autoscroll QTimer, by default False
timespan (float, optional) – The timespan to set for autoscrolling along the x-axis in seconds, by default 60
padding (float, optional) – The size of the empty space between the data and the sides of the plot, by default 0.1
refresh_rate (int, optional) – How often the scroll should occur in milliseconds, by default 5000
ArchivePlotCurveItem
- class pydm.widgets.archiver_time_plot.ArchivePlotCurveItem(channel_address: Optional[str] = None, useArchiveData: bool = True, liveData: bool = True, showExtensionLine: bool = False, optimized_data_bins: Optional[int] = None, **kws)[source]
Bases:
TimePlotCurveItemArchivePlotCurveItem is a TimePlotCurveItem with support for receiving data from the archiver appliance.
- Parameters:
channel_address (str) – The address to of the scalar data to plot. Will also be used to retrieve data from archiver appliance if requested.
use_archive_data (bool) – If True, requests will be made to archiver appliance for archived data when the plot is zoomed or scrolled to the left.
liveData (bool) – If True, the curve will gather data in real time.
show_extension_line (bool) – If True, shows a line that extends from the right-most point to the future. Defaults to False.
optimized_data_bins (int, optional) – The number of data bins to use for optimized data retrieval from the archiver.
**kws (dict[str: any]) – Additional parameters supported by pyqtgraph.PlotDataItem.
- archiveConnectionStateChanged(connected: bool) None[source]
Capture the archive channel connection status and emit changes
- Parameters:
connected (bool) – The new connection status of the archive channel
- property color: QColor
The color used for the curve.
- Return type:
QColor
- insert_archive_data(data: ndarray) None[source]
Inserts data directly into the archive buffer.
An example use case would be zooming into optimized mean-value data and replacing it with the raw data.
- Parameters:
data (np.ndarray) – A numpy array of shape (2, length_of_data). Index 0 contains timestamps and index 1 contains the data observations.
- property lineWidth: int
Return the width of the line connecting the data points.
- Return type:
int
- max_archiver_x()[source]
Provide the the most recent timestamp from the archiver data buffer. This is useful for scaling the x-axis.
- Returns:
The timestamp of the most recent data point in the archiver data buffer.
- Return type:
float
- min_archiver_x()[source]
Provide the the oldest valid timestamp from the archiver data buffer.
- Returns:
The timestamp of the oldest data point in the archiver data buffer.
- Return type:
float
- receiveArchiveData(data: ndarray) None[source]
Receive data from archiver appliance and place it into the archive data buffer. Will overwrite any previously existing data at the indices written to. Skips processing entirely when the curve is hidden.
- Parameters:
data (np.ndarray) – A numpy array of varying shape consisting of archived data for display. At a minimum, index 0 will contain the timestamps and index 1 the actual data observations. Additional indices may be used as well based on the type of request made to the archiver appliance. For example optimized data will include standard deviations, minimums, and maximums
- receiveNewValue(new_value: float) None[source]
Fill incoming live data if requested by user. Skips processing when the curve is hidden.
- Parameters:
new_value (float) – The new y-value to append to the live data buffer
- redrawCurve(min_x=None, max_x=None) None[source]
Redraw the curve with any new data added since the last draw call. Skips rendering if the curve is not visible.
- resetArchiveBufferSize() None[source]
Reset the length of the archive buffer back to the default and zero it out
- setArchiveBufferSize(value: int) None[source]
Set the length of the archive data buffer and zero it out
- setLogMode(xState: bool, yState: bool) None[source]
When log mode is enabled for the respective axis by setting xState or yState to True, a mapping according to mapped = np.log10( value ) is applied to the data. For negative or zero values, this results in a NaN value.
- Parameters:
xState (bool) – Set log mode for the x-axis
yState (bool) – Set log mode for the y-axis
- setVisible(visible: bool) None[source]
Propagate visibility changes to extension line and error bar. When hiding, clears the displayed curve data so it disappears immediately. When showing, triggers a redraw to re-render from data buffers.
- set_error_bar()[source]
Update the data in the ErrorBarItem. Applies log10 to the ErrorBarItem based on the curve’s log mode.
- set_extension_line_data() None[source]
Creates a dotted line from the latest point in the buffer (live or archived depending on if live data is active).
- show()[source]
Propagate visibility changes to extension line and error bar. Re-renders the curve from existing data buffers.
- to_dict() OrderedDict[source]
Returns an OrderedDict representation with values for all properties needed to recreate this curve.
- viewRangeChanged(vb=None, ranges=None, changed=None)[source]
Skip view range updates (triggered by scroll/zoom) when curve is hidden.
- property y_axis_name: str
Return the name of the y-axis that this curve should be associated with. This allows us to have plots that contain multiple y-axes, with each curve assigned to either a unique or shared axis as needed. :rtype: str
FormulaCurveItem
- class pydm.widgets.archiver_time_plot.FormulaCurveItem(formula: str = None, pvs: dict = None, use_archive_data: Optional[bool] = True, liveData: Optional[bool] = True, color: Optional[str] = 'green', plot_style: str = 'Line', **kws)[source]
Bases:
BasePlotCurveItemFormulaCurveItem is a BasePlotCurve that takes in a formula of curves and evaluates to graph a function.
To use, instead of typing in a PV channel, this takes in the prefix ‘f://’ to indicate a function, then uses curly braces ‘{<PV row header>}’ to find which curves to use as inputs. Other than that, FormulaCurveItems have the capacity to handle basic arithmetic functions and also special functions like log() and trigonometry.
Finally, when populating its data buffers, it uses the union of the timesteps for each of its input curves, and uses last seen data to fill in the gaps when calculating.
- Parameters:
formula (str) – The formula that we are graphing
use_archive_data (bool) – If True, requests will be made to archiver appliance for archived data when the plot is zoomed or scrolled to the left.
pvs (dict[str: BasePlotCurveItem]) – Has all the information for our FormulaCurveItem to evaluate the value at every timestep
**kws (dict[str: any]) – Additional parameters supported by pyqtgraph.PlotDataItem.
- property address: str
Alias so tools expecting .address (like ArchivePlotCurveItem) work.
- arch_conn_change(status: bool) None[source]
Capture the archive channel connection status of a given curve and check connection status
- Parameters:
status (bool) – Archive connection status for a given curve
- checkFormula() bool[source]
Make sure that our formula is still valid. Namely, all of the input curves need to still exist in the viewer
- compute_evaluation(formula: str, pvData: dict, pvValues: dict, pvIndices: dict, archive: bool) ndarray[source]
This is where the actual computation takes place. We are going to go through the data step by step and calculate our formula at each timestamp available.
- Parameters:
formula (str) – The formula to compute
pvData (dict) – A dictionary containing all of the Archive or Live data for each curve
pvValues (dict) – The value of each curve at the current timestep. At the start of this function, each is set to their respective last seen values when the time is equal to the latest start time of all of the curves.
pvIndices (dict) – A dictionary storing where in each curve’s data buffer we are currently at while calculating
archive (bool) – Whether or not this is computing for the Archive or for Live
- Returns:
output – formula curve data
- Return type:
np.ndarray
- connection_status_check()[source]
Check the connection status of all live and archive curves. Save and emit any changes.
- createTrueFormula() str[source]
Convert our human-readable formula to something easier to use for the computer, in the background only
- evaluate() None[source]
Use our formula and input curves to calculate our value at each timestep. If one curve updates at a certain timestep and another does not, it uses the previously seen data of the second curve, and assumes it is accurate at the current timestep.
- live_conn_change(status: bool) None[source]
Capture the live channel connection status of a given curve and check connection status
- Parameters:
status (bool) – Live connection status for a given curve
- max_archiver_x()[source]
Provide the the most recent timestamp from the archiver data buffer. This is useful for scaling the x-axis.
- Returns:
The timestamp of the most recent data point in the archiver data buffer.
- Return type:
float
- min_archiver_x()[source]
Provide the the oldest valid timestamp from the archiver data buffer.
- Returns:
The timestamp of the oldest data point in the archiver data buffer.
- Return type:
float
- on_dependency_archive_data_received()[source]
Called when any dependency curve receives new archive data
- on_dependency_data_changed()[source]
Called when any dependency curve’s data changes (live or archive)
- redrawCurve(min_x=None, max_x=None) None[source]
Redraw the curve with any new data added since the last draw call. Skips rendering if the curve is not visible.
- resetArchiveBufferSize() None[source]
Reset the length of the archive buffer back to the default and zero it out
- setArchiveBufferSize(value: int) None[source]
Set the length of the archive data buffer and zero it out
- set_up_eval(archive: bool) dict[source]
Because we are doing very similar evaluations for Archive and Live Data, we are going to set up our data structures such that we can compute our evaluation more easily. This function will (generally) be called twice, once with archive = True, once with False
- Parameters:
archive (bool) – Whether this is setting up for Archive Data or Live Data